UI Overview
The five zones of the Serpentine graph viewer.
When you run serpentine serve, Serpentine opens a browser window with an interactive graph viewer. The interface is divided into five zones that work together.
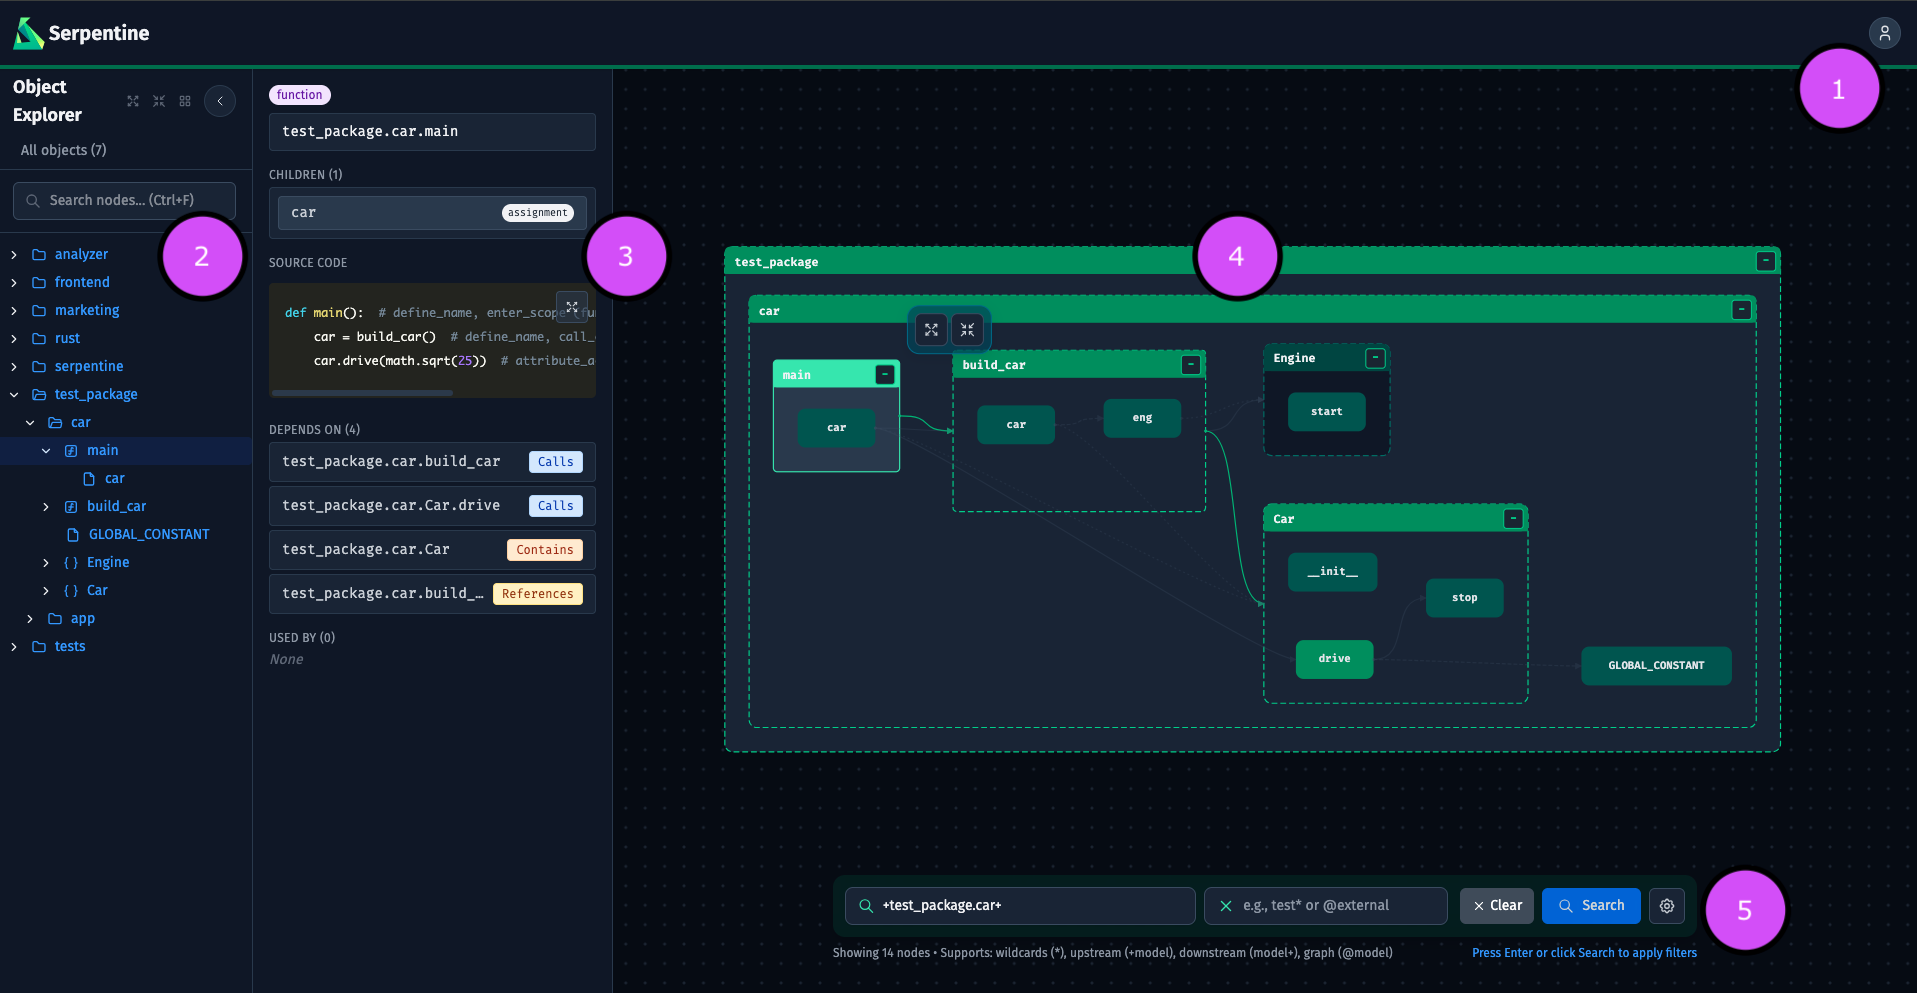
1. Header
The top bar runs the full width of the screen. It contains the Serpentine logo on the left, a VCS compare toolbar in the center (visible when Serpentine is running inside a git repository with the [git] extra installed), and a settings button on the right. The compare toolbar lets you select any two refs and see structural changes highlighted on the graph. Click the settings button to open a dropdown with layout controls, spacing adjustments, theme switching, and expand/collapse-all shortcuts. See Reference → Header for every option.
2. Object Explorer
The collapsible sidebar on the left lists every node in the graph as a tree: modules at the top level, with classes and functions nested inside. You can search the tree, expand or collapse branches, and click any node to select it and jump to it in the canvas. When files change on disk, the sidebar highlights added, modified, and deleted nodes in color. See Reference → Object Explorer for details.
3. Detail Panel
When a node is selected the Detail Panel opens on the right side of the canvas. It shows the node’s full ID, type, source location, docstring, syntax-highlighted source code, and two lists: the node’s dependencies and the nodes that depend on it. Every entry in those lists is clickable. See Reference → Detail Panel.
4. Graph Canvas
The central area is an SVG canvas showing the code reference graph. You can pan by dragging and zoom with the scroll wheel. Each rectangle is a node (module, class, function, assignment, etc); the arrows between them are edges that encode the relationship type. Clicking a node selects it, opens the Detail Panel, and reveals a mini-toolbar for expanding or collapsing its children. See Reference → Graph Canvas.
5. Search Bar
The floating bar at the bottom of the canvas is the primary way to filter the graph. Type a selector expression in the include field (and optionally an exclude expression in the second field), then press Enter or click Search. The graph updates to show only the matching subgraph. Type state: to see autocomplete suggestions for filtering by change status (state:modified, state:added, state:deleted) — these compose with all graph operators. A settings gear opens additional options: package filters, edge depth control, edge type toggles, and export actions. See Reference → Search Bar.
Next steps
- UI Reference — every control documented
- Selectors — the selector syntax used in the search bar